





Full-stack data analyst · AI operations lead

I speak SQL and boardroom.

I build the pipelines, dashboards and models teams make decisions with, across data engineering, BI and data science. Now AI Operations Lead at Astor Realty Enterprise, after APAC reporting and AI automation at Citi.

See my work LinkedIn

30–40%
Less manual reporting at Citi
12
Projects you can explore
5
Professional certifications
26
Tools across the stack
Matthew Ferrer in a dark suit
Matthew FerrerFull-stack data analyst · AI operations leadOpen to remote data, BI and AI operations roles

Certified by

  • AWS
  • IBM
  • SAP
  • Google
  • Meta

Worked at

  • Astor Realty Enterprise
  • Citi
  • BE3 Power Solutions Enterprise

What I do

One analyst across the whole data stack

  1. 01

    Data engineering

    Reports rebuilt by hand every week.

    I build pipelines that clean, validate and load data automatically, in SQL, Snowflake and ETL tools.

    30–40% less manual reporting at Citi
  2. 02

    BI & analytics

    Dashboards nobody trusts or opens.

    I design dashboards around the decisions people make, with the filters they ask for, in Tableau, Power BI and Looker Studio.

    7 service ratings and 5 filters in one view
  3. 03

    Data science

    Questions a dashboard can’t answer.

    I explore and model data in Python, from cleaning and statistics to language models built from scratch.

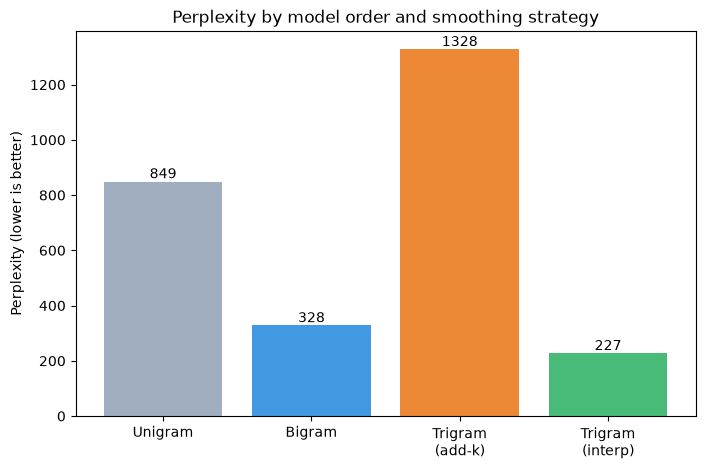
    849 → 227 perplexity, unigram to trigram
Matthew Ferrer in a black suit and tie

How I work

The question first, then the query

  1. Start with the question

    Before I touch the data, I write down what the business needs to decide. For the Amazon project that meant revenue potential, product quality and where to focus marketing.

    See the Amazon project
  2. Check the data before the chart

    I clean and validate before I chart anything. For my AML project I checked 6.3 million transactions in SQL and logged every removed row. At Citi I validated supplier master data with SQL.

    See the AML project
  3. Build the view people use

    A dashboard earns its place with the filters people ask for. My British Airways dashboard switches metric, seat type, aircraft and continent in one view.

    See the dashboard
  4. Make it repeat itself

    When a report runs every week, I automate it. At Citi I moved APAC reporting onto Tableau and SQL pipelines, and cut manual reporting effort by 30–40%.

    See the result

Selected work

Projects with the receipts

Five featured projects, then seven more. Each card shows the work, the tools and how I built it.

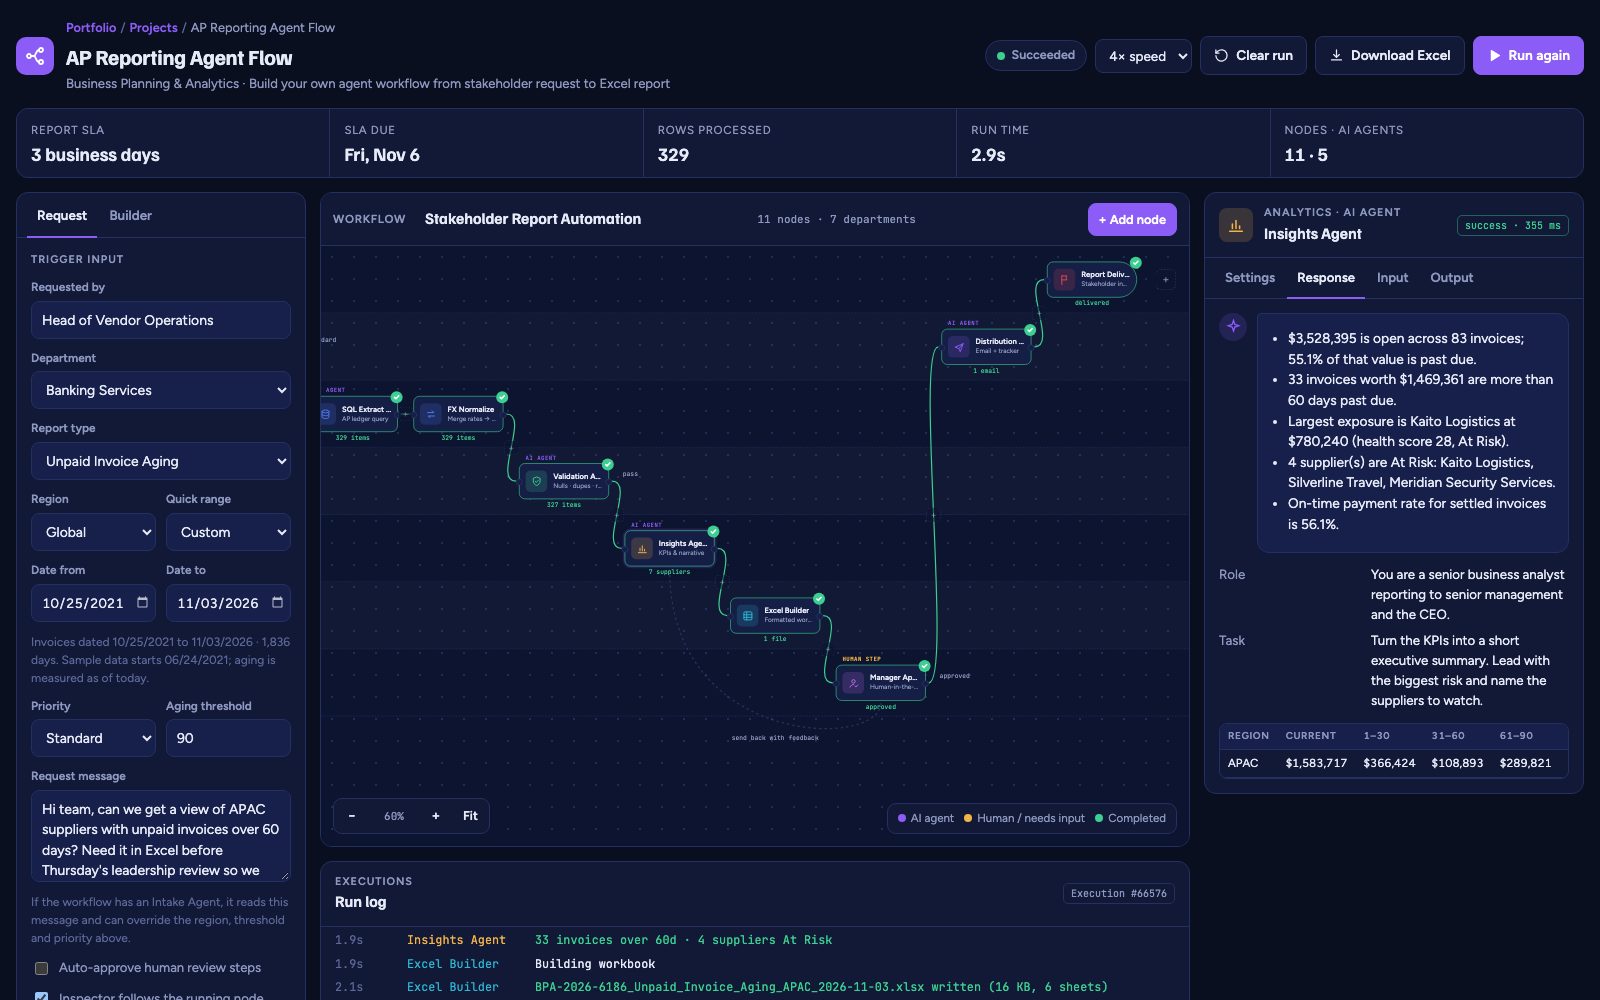
AP Reporting Agent Flow builder after a successful run: a request form with a 10/25/2021 to 11/03/2026 date range, a workflow canvas of AI agent nodes in department swimlanes from SQL extract to Excel builder and manager approval, and the Insights Agent response with open value, past-due share and suppliers at risk
Latest project. Click any node to see its agent response, input and output; the Excel report builds in the browser.

AP Reporting Agent Flow

AI automation · AI agents, Excel

Stakeholder request to Excel report across 7 departments

An n8n-style workflow builder where AI agents for each department take a report request from intake to a formatted Excel workbook. It is modeled on the payables reporting I ran at Citi, with a 3-business-day SLA and a manager sign-off.

n8n · JavaScript · SQL · ExcelJS · Claude · Prompt design

How I did it
  • Mapped my Citi reporting process into seven department lanes: stakeholders, intake, data engineering, data quality, analytics, reporting and management review.
  • Gave every AI agent an editable role and task. Nodes can be added, removed, reordered, deactivated or moved between departments, and missing steps are flagged before a run.
  • Kept the numbers deterministic on a 900-invoice sample ledger: a read-only SQL extract by date range, FX to USD, duplicate and null checks with control-total reconciliation, aging buckets and supplier health scores.
  • Added a human approval step that can send the run back to Analytics with feedback, which produces a new revision of the report.
  • Generated a styled .xlsx in the browser with ExcelJS: summary, aging by region, supplier health, open invoices, data quality, agent notes and the run log.
  • Rebuilt the same flow as an importable n8n workflow: a request form trigger, Claude agent nodes, a priority switch, Postgres extract, validation gate, Gmail approval with a send-back loop, Excel file and a Google Sheets tracker, with each department as a swimlane.
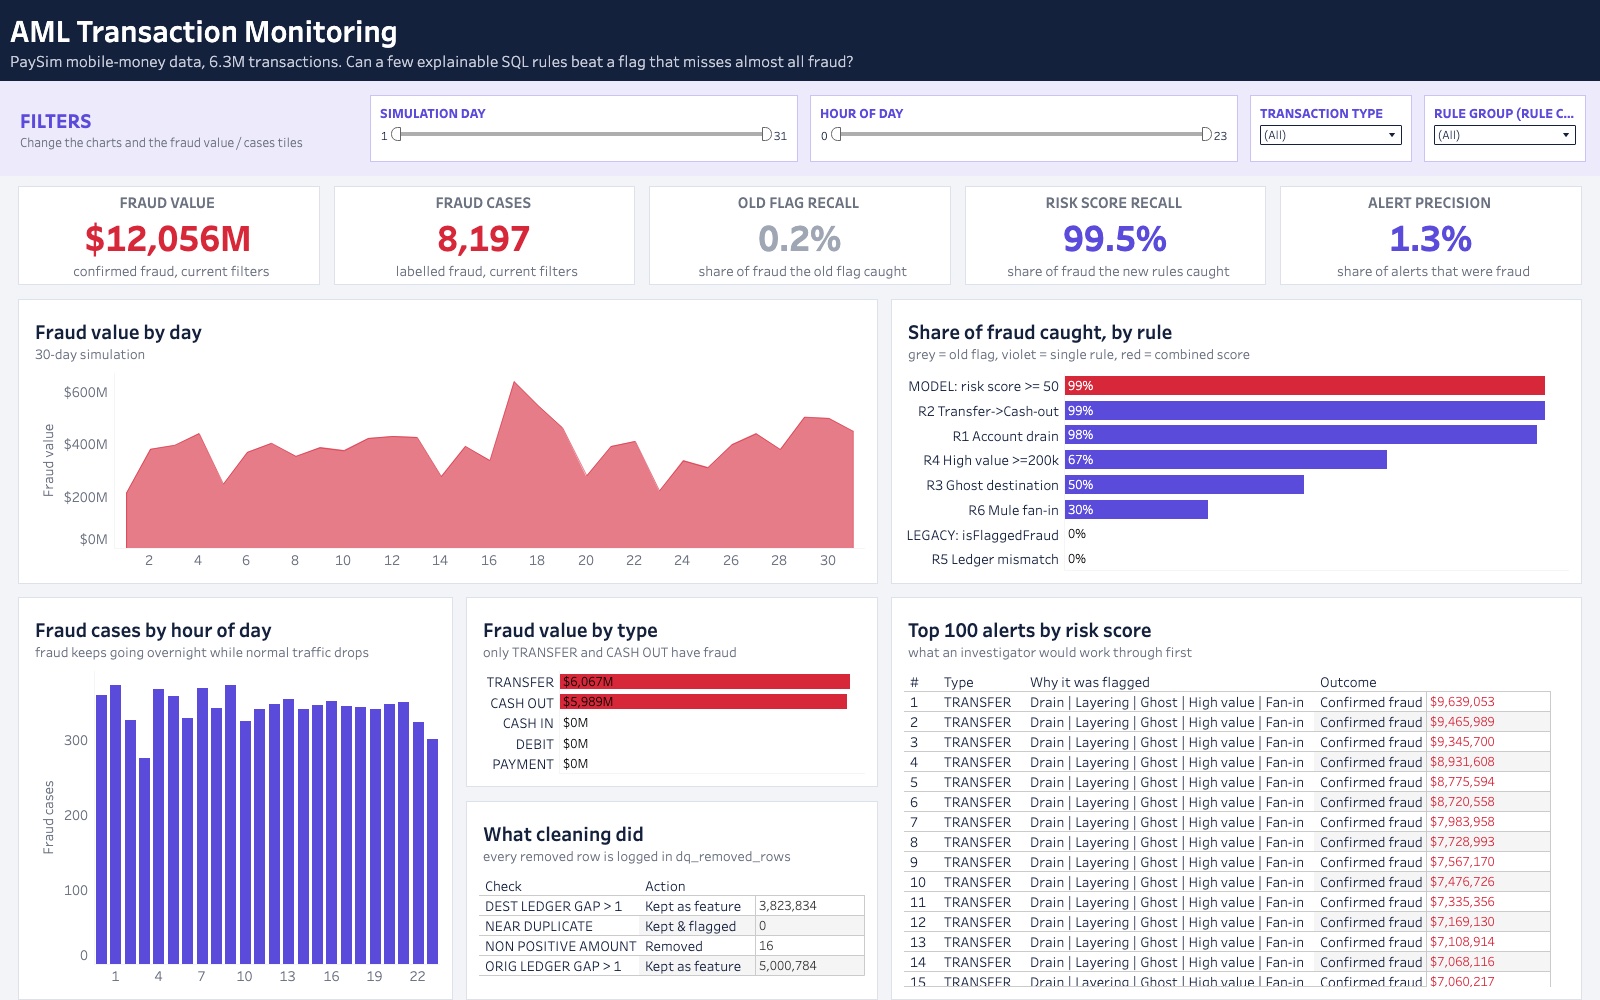
Tableau dashboard, AML Transaction Monitoring, with filters for simulation day, hour of day, transaction type and rule group: $12,056M fraud value, 8,197 fraud cases, old flag recall 0.2% against 99.5% for the risk score, fraud by day, hour and type, share of fraud caught by rule, a data cleaning summary and the top 100 alerts
Screenshot of the live Tableau Public dashboard; the workbook is in the repository.

AML transaction monitoring in SQL

Financial crime · SQL, Tableau

Fraud caught: 0.2% before, 99.5% after

Six explainable fraud rules in SQL on 6.3 million PaySim mobile-money transactions. The operator’s own flag caught 16 of 8,197 fraud cases; the combined risk score catches 8,154.

SQL · SQLite · MySQL · Python · Tableau

How I did it
  • Loaded the 470 MB CSV into SQLite with Python in 500,000-row chunks, keeping each row’s line number so any alert traces back to the file.
  • Cleaned it in SQL: every removed row is logged with its reason, and a check confirms raw = clean + removed. Balance mismatches are kept as a signal, not deleted.
  • Wrote six weighted rules, from account drain and transfer-then-cash-out to mule fan-in. None of them uses the fraud label, and every alert shows which rules it hit.
  • Measured precision and recall for the old flag, each rule and the combined score. Transfer-then-cash-out alone catches 99.5% of fraud at 90% precision.
  • Built a Tableau workbook on the SQL output: KPI tiles, fraud by day and hour, recall by rule, a data quality panel and the alert queue. The same SQL also runs on MySQL 8.
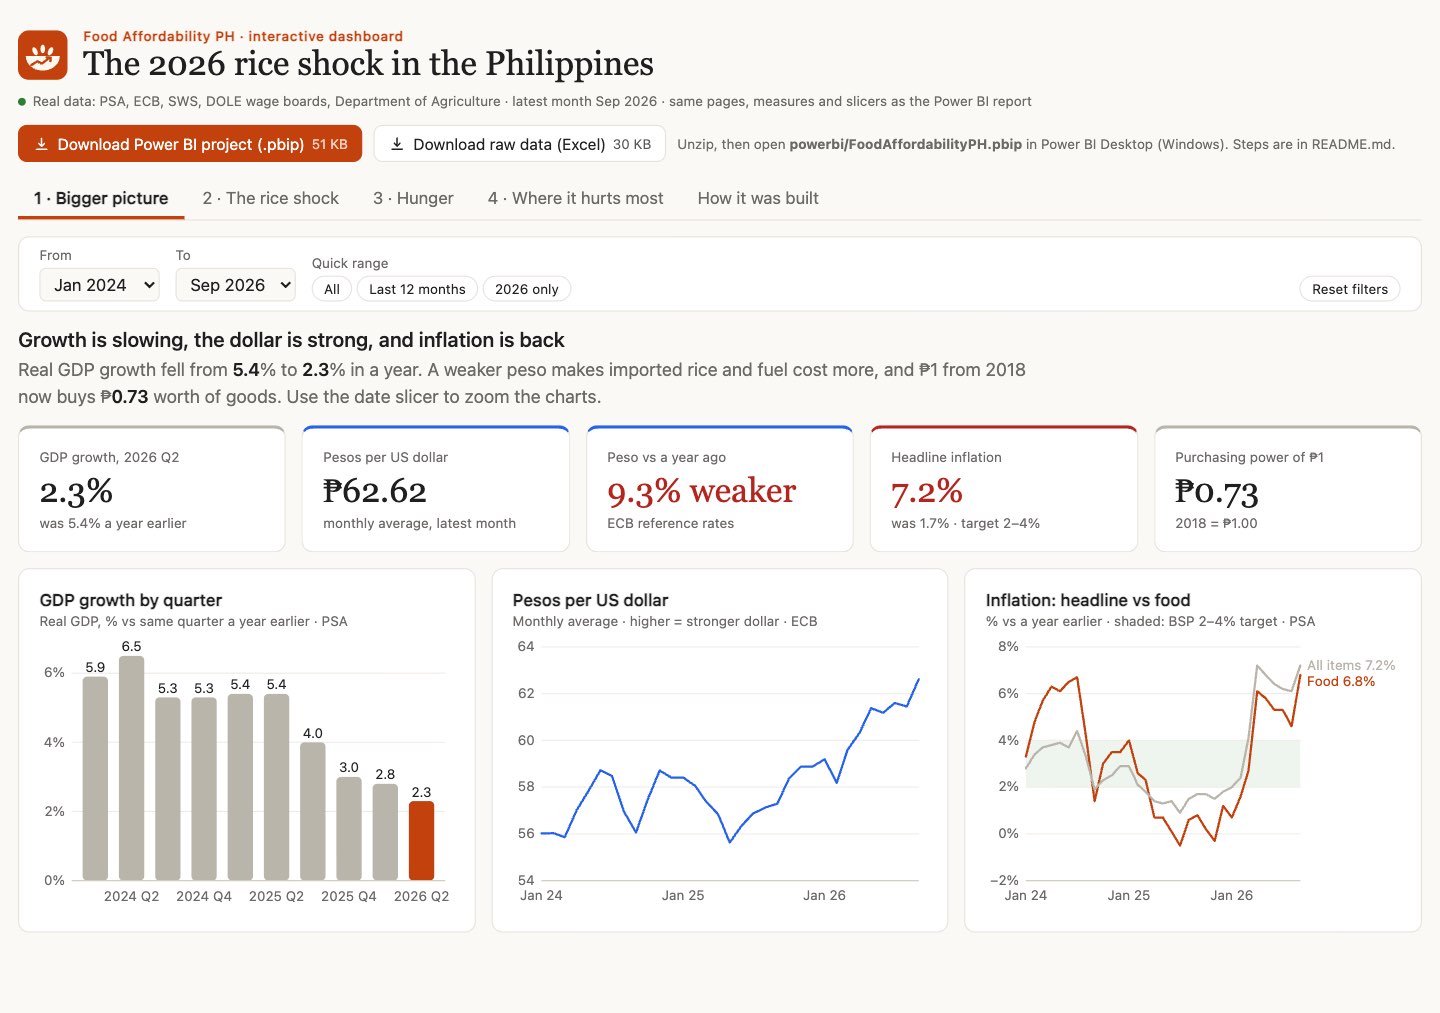
Interactive dashboard titled “The 2026 rice shock in the Philippines”: GDP growth down to 2.3%, ₱62.62 per US dollar, headline inflation at 7.2% against the 2–4% target
The web version of the Power BI report, with the same pages, measures and slicers.

Food affordability in the Philippines, 2026

Economics · Power BI, Python

Rice inflation from −17% to +20% in a year

A Power BI data story on official PSA, ECB, SWS and DOLE data: which regions the 2026 rice price shock hits hardest, and where relief should go first.

Python · Power Query · DAX · Power BI

How I did it
  • Pulled rice prices, inflation, GDP and exchange rates from the PSA OpenSTAT and ECB APIs into Excel with Python.
  • Cleaned the data in Power Query: unpivoted month columns, turned unreleased-month placeholders into nulls and matched PSA’s two region-naming styles.
  • Modelled a star schema with Calendar and Region tables and wrote 46 DAX measures, including latest-month against year-earlier comparisons.
  • Checked every layer with a Python script before sharing: queries, columns, measures and expected card values all agree.
  • Found that 12 of 18 regions have rice inflation above the national 20.3%, led by Western Visayas at 30.0%.
Recorded from the live Tableau Public dashboard, sped up 2.5 times.

British Airways passenger reviews

Customer experience · Tableau

7 service ratings, 5 filters, one view

An independent Tableau dashboard of passenger reviews from 2016 to 2023, comparing ratings by month, country, aircraft and seat type.

Tableau · Customer experience · Dashboard design

How I did it
  • Brought the review data into one view to compare service areas: cabin staff, entertainment, food, ground service, seat comfort and value.
  • Added filters for continent, aircraft, traveller type, seat type and date, plus a metric switcher for every chart.
  • Independent portfolio project, not affiliated with British Airways.
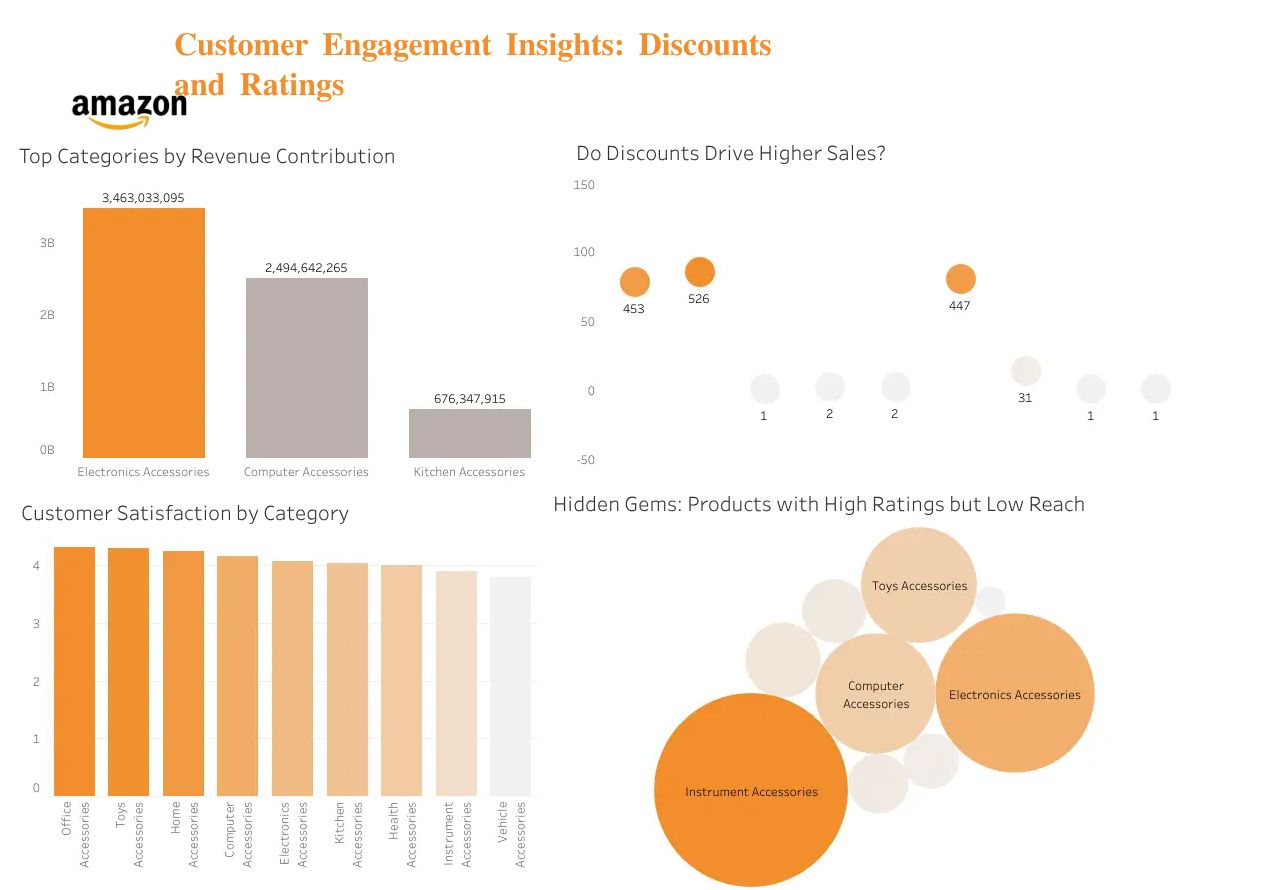
Tableau dashboard: revenue by category, discounts against sales, satisfaction by category and high-rated products with low reach

Amazon product insights & customer experience

Business intelligence · SQL, Tableau

1,464 products cleaned in MySQL

A Tableau dashboard on Amazon product data, cleaned in MySQL first, to explore pricing, discounts, ratings and customer experience.

SQL · Tableau · Data cleaning

How I did it
  • Framed business questions on revenue potential, quality, marketing priorities, engagement and readiness for a recommendation system.
  • Cleaned and transformed price, discount, rating-count and category fields in MySQL, including missing-value imputation and clearer category names.
  • Built a price × rating-count proxy for revenue potential, for exploratory comparison only. It is not actual revenue or verified sales volume.
  • Designed an interactive dashboard with category drill-downs, product comparisons, rating distributions and marketing opportunities.
  • Prepared the review data for later sentiment analysis, segmentation, forecasting and recommendation work.

More work

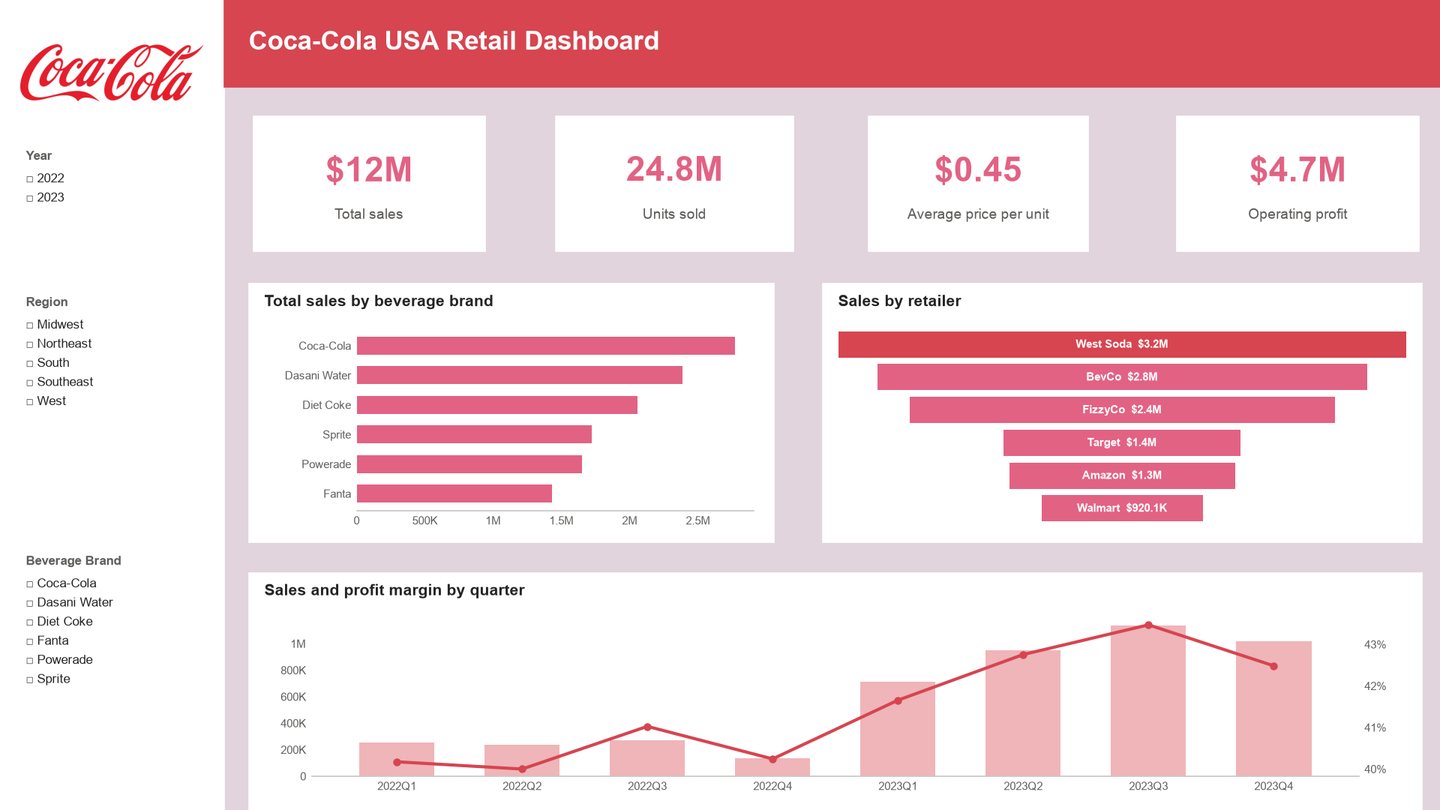
Coca-Cola USA retail dashboard: total sales $12M, units sold, average price, operating profit, sales by brand and retailer, and profit margin by quarter
Preview rebuilt from the report’s layout and dataset. Download the PBIX to open the original in Power BI.

Coca-Cola retail sales dashboard

Retail sales · Power BI, Excel

$12M in sales by brand, retailer and quarter

A Power BI report on US retail sales of Coca-Cola brands: sales, units, average price and operating profit by brand, retailer and quarter.

Power BI · Excel · Retail analytics

How I did it
  • Prepared the retail sales workbook in Excel and loaded it into Power BI.
  • Built interactive pages that compare brands, retailers and quarters, with a profit-margin trend.
Bar chart of perplexity by model: unigram 849, bigram 328, trigram with add-k smoothing 1,328, interpolated trigram 227

Statistical language modelling

Natural language processing · Python

Perplexity cut from 849 to 227

Built n-gram language models from scratch in Python. An interpolated trigram reached the lowest perplexity: 227, against 849 for a unigram.

Python · NLTK · NumPy · Matplotlib · Probability

How I did it
  • Wrote reusable modules for preprocessing, tokenisation, vocabulary building and probability estimation.
  • Explored the corpus with word-frequency and Zipf’s-law plots.
  • Compared unigram, bigram and trigram models with add-k smoothing and interpolation, then generated sentences from them.
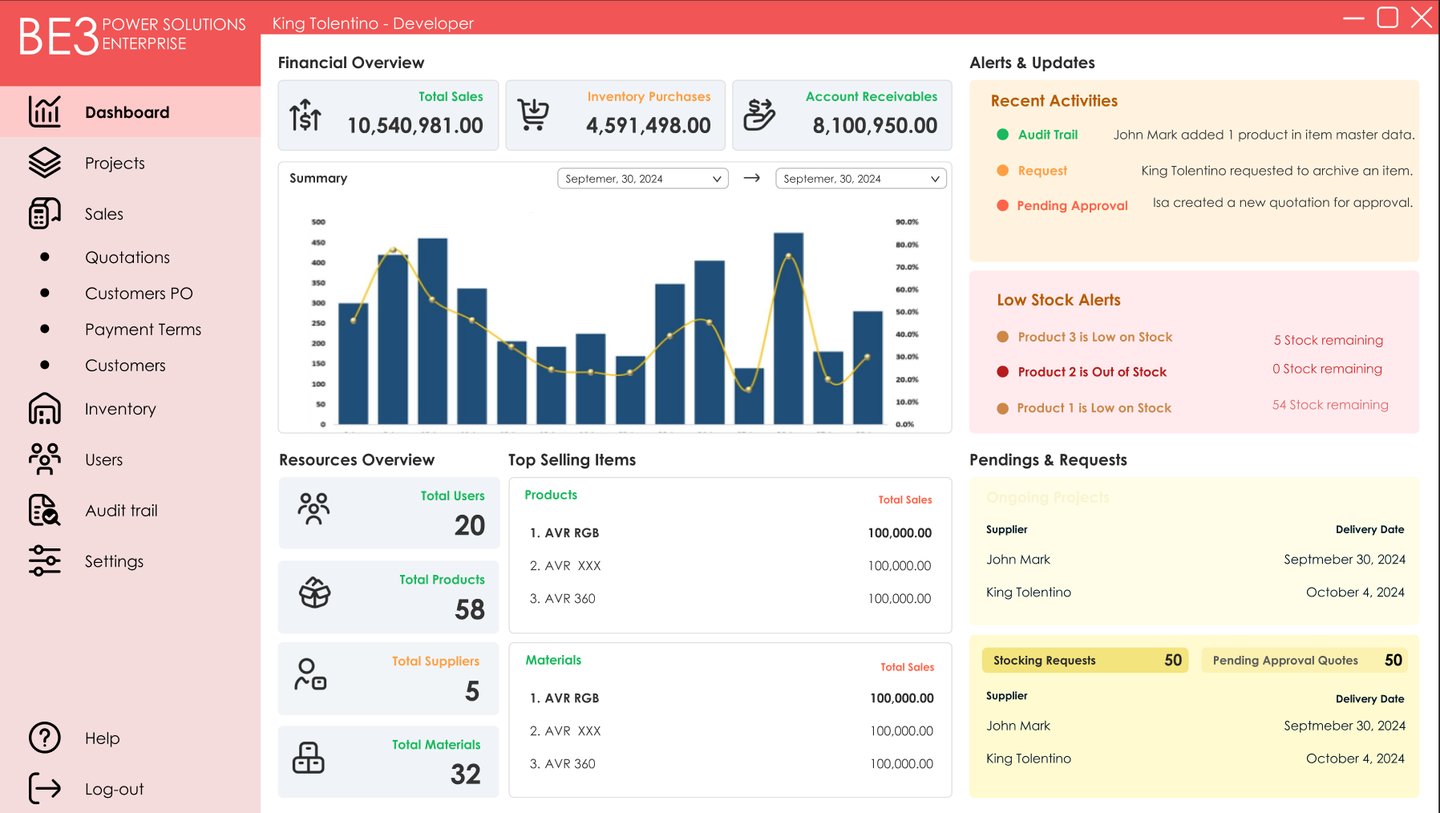
BE3 system dashboard: total sales, inventory purchases and receivables, a monthly sales chart, low-stock alerts and pending requests

Project monitoring & inventory system

Academic capstone · C#, MySQL, Figma

Tested by staff in 4 roles

A system for BE3 Power Solutions that brings project progress, sales and inventory into one workflow. Its screens were designed in Figma, and BE3 staff tested the build.

C# · MySQL · Figma · Database design · Systems analysis

How I did it
  • Mapped project and inventory workflows into one system for status tracking, accountability and restocking.
  • The Figma interface covers login, a dashboard with sales, purchases and receivables, low-stock alerts, and colour-coded project tracking.
  • Applied requirements analysis, relational data modelling and reporting to a real operational use case.
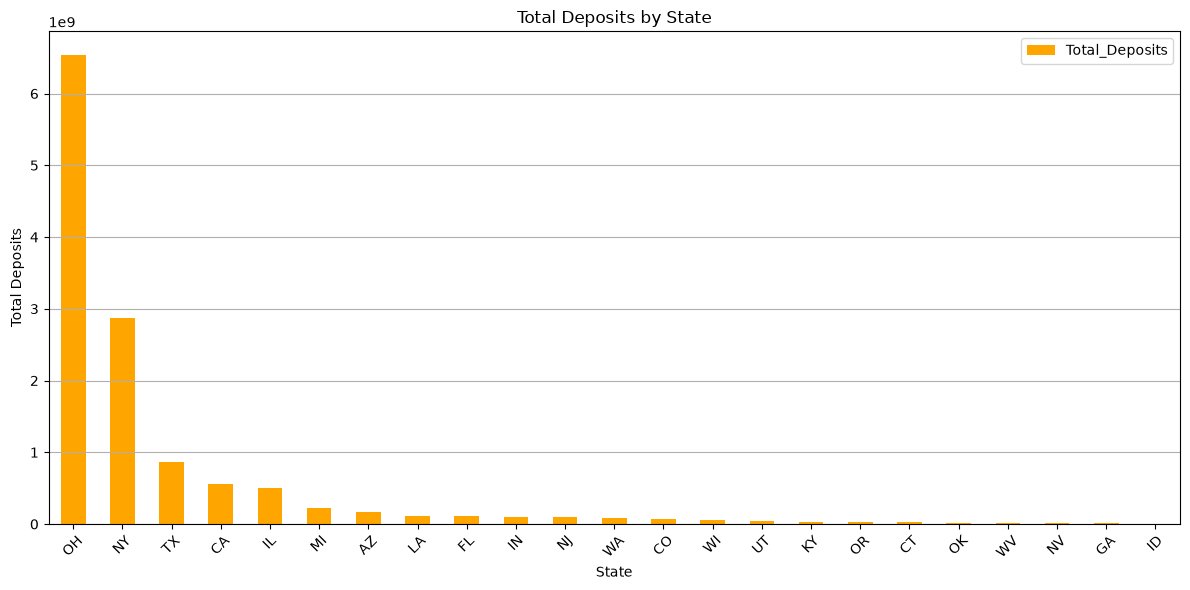
Bar chart of total deposits by state, led by Ohio, New York and Texas

Bank branch deposit analysis, 2010–2016

Financial performance · Python

Analysed seven years of branch deposits to find trends, geographic concentration and branch-level growth opportunities.

Python · Pandas · Matplotlib · Jupyter

How I did it
  • Prepared the data: converted dates, handled missing values, validated deposit columns and removed duplicates.
  • Created Branch Age, Years Since Acquisition, Total Deposits, Growth % and CAGR metrics to compare performance.
  • Analysed yearly trends, top and declining branches, and contributions by state and city.
  • Found steady growth through 2015, a notable decline in 2016, and deposits concentrated in a small number of branches.
  • Laid the groundwork for deposit forecasting, branch clustering and monitoring dashboards.
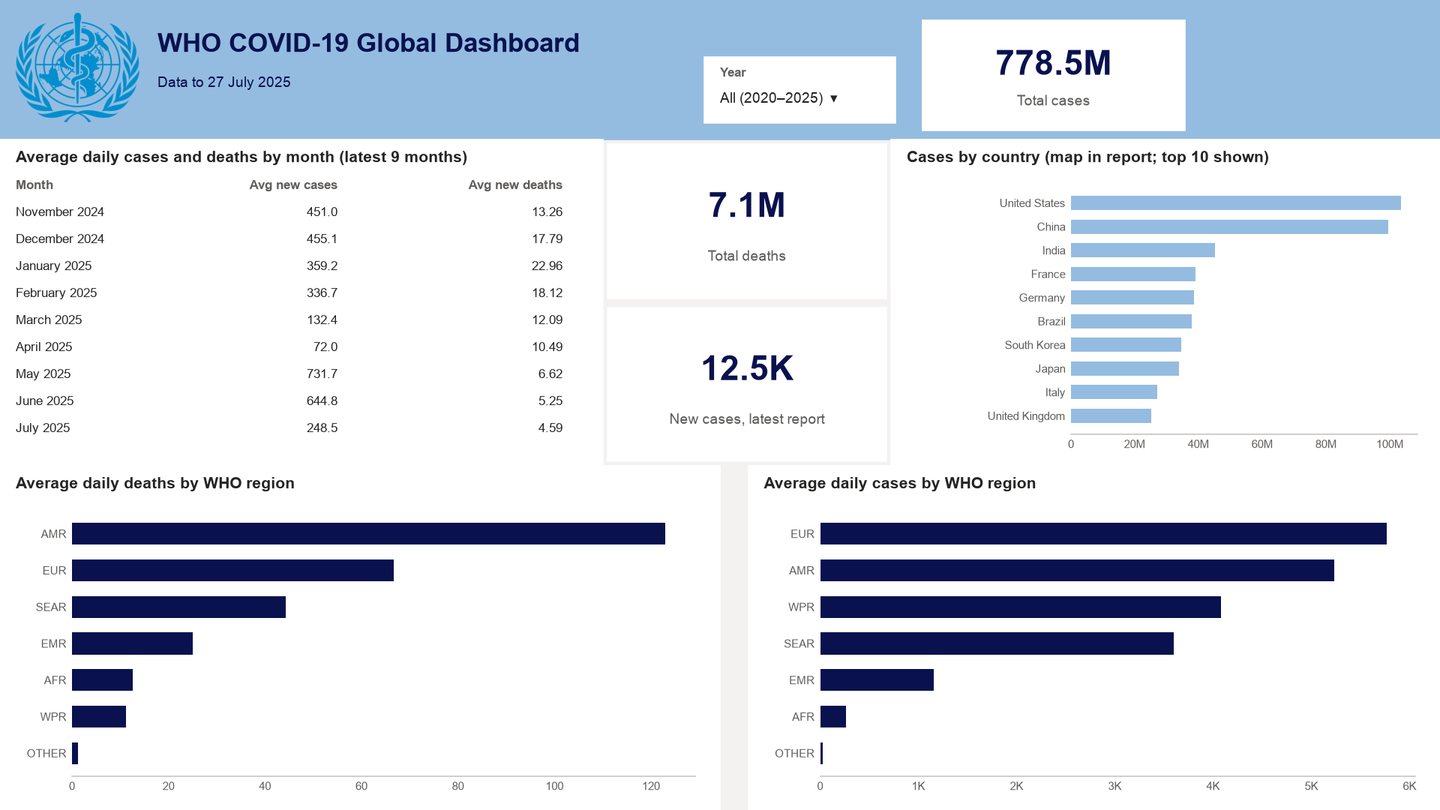
WHO COVID-19 dashboard: 778.5 million total cases, 7.1 million deaths, monthly averages, top countries and averages by WHO region
Preview rebuilt from the report’s layout and dataset. Download the PBIX to open the original in Power BI.

WHO COVID-19 global dashboard

Global health · Power BI

A Power BI dashboard on WHO daily reporting data that tracks global cases, deaths and regional trends over time.

Power BI · WHO data · Time series

How I did it
  • Worked with date reported, country, WHO region, new and cumulative cases, and new and cumulative deaths.
  • Structured the dashboard around country comparison, cumulative impact, daily change and trend monitoring.
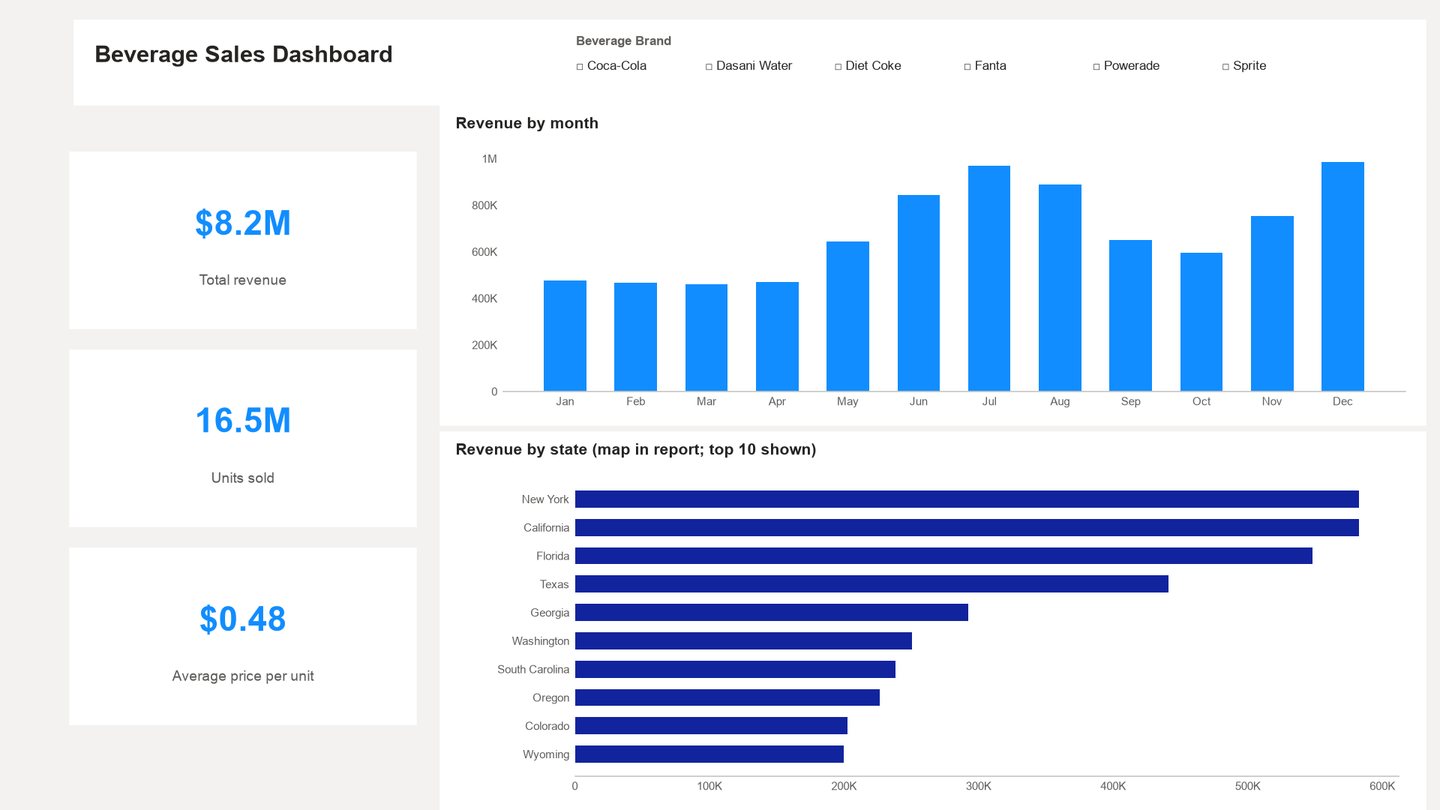
Beverage sales dashboard: $8.2M revenue, units sold, average price, revenue by month and top states
Preview rebuilt from the report’s layout and dataset. Download the PBIX to open the original in Power BI.

Beverage company sales dashboard

Consumer goods · Power BI, Excel

A Power BI report on beverage company sales: revenue, units and average price by month, with the top states.

Power BI · Excel · Sales analysis

How I did it
  • Prepared the beverage sales workbook for interactive reporting and company-level comparison.
  • Built monthly report pages and a top-states ranking.
Command-line tool

PDF to Word converter

Automation · Python

A Python tool that batch-converts PDFs into editable Word files and logs progress, errors and conversion statistics.

Python · pdf2docx · tqdm · Automation

How I did it
  • Added batch conversion, automatic folder creation, progress bars, timing and skipping of files already converted.
  • Added structured logging, coloured terminal output, error handling and automatic opening of the output folder.
  • Built with Python 3, pdf2docx, tqdm, colorama and pathlib.

astorrealtyenterprise.com

The full Astor Realty Enterprise homepage: Manhattan hero, featured sold properties, the broker profile, questions and answers, and contact The Salon Privé & Co. homepage: extension services, the studio, transformations and the booking steps The Marque Vault Classics homepage: classic picture cars, the current floor and production rental services

Client websites

Websites I run

Astor Realty Enterprise

Residential and commercial real estate in New York, and my current employer. I manage its listings, copy and search visibility.

Visit the site

Salon Privé & Co.

Hair extensions, makeup and styling in New York City. I keep its pages, images and copy up to date and work on its search rankings.

Visit the site

Marque Vault Classics

Classic picture cars for film and TV in New York City. I build and update its pages and handle keyword research and technical SEO.

Visit the site

Experience

Where I’ve worked

  1. Sep 2026 – now

    AI Operations Lead

    Astor Realty Enterprise LLC · New York, remote

    I lead a remote team and run AI and digital operations for the company, working directly with the CEO on AI workflows, SEO and AI visibility, analytics, CRM, web development, lead generation and reporting.

    • Built AI workflows for lead research and outreach, CRM automation and CEO reporting, and trained the team to use them.
    • Set up Close CRM and its dialer for the team, including users, subscriptions and billing.
    • Build and update three client websites with Claude Code and Lovable: listings, images, copy and technical SEO.
    What I do
    • Team leadership. Lead a five-person team across website content, outreach and lead generation. Onboard people to tools, accounts and dialer numbers, and set priorities and deadlines across sites and campaigns.
    • SEO and AI visibility. Monitor website KPIs in SE Ranking, run site audits and analyse competitors’ keywords. Researched 300+ keywords for one site and 480+ for another, favouring lower difficulty and higher search volume. Track AI prompts (now at 100% AI visibility) and recommend paid ads, referrals, reviews and before-and-after content.
    • AI lead workflows. Source leads with LinkedIn Sales Navigator, use AI to research and qualify them, and draft personalised outreach. Write hashtags and help with Instagram posts and reels.
    • CRM automation. Automate Close CRM workflows: email and SMS sequences, call logging and lead status updates.
    • AI reporting for the CEO. Use AI to draft the weekly and monthly SEO, analytics and finance summaries from SE Ranking and other data. Prepare stakeholder presentations and keep day-to-day operations moving.
    • AI tool rollout and training. Choose AI tools for the team, write prompts and playbooks, and train the team to use them.
    • Vendors and tools. Evaluate tools and plans, explain pricing to the team, and negotiate trial extensions, upgrades and discounts with vendors.
    • This portfolio. Designed and built in VS Code, versioned with Git and deployed on GitHub Pages.

    Claude Code · Lovable · SEO · SE Ranking · Close CRM · LinkedIn Sales Navigator · ClickUp · GitHub Pages · Git · VS Code

  2. Oct 2025 – Oct 2026

    Business Planning & Analytics Officer

    Citi · BGC, Taguig

    APAC reporting for Balance of Trade and Procure-to-Pay operations: supplier insights, executive dashboards and agentic AI automation.

    • Designed executive dashboards on supplier performance, payment risk, operational KPIs and procurement health.
    • Improved data quality through supplier master-data governance, SQL validation and standard reporting.
    • Built agentic AI automations that refresh reports, check data quality and draft executive commentary, part of a 30–40% cut in manual reporting.
    What I did
    • Managed enterprise reporting across Tableau, MicroStrategy, Quantum GEP, Zephyr and SAP Fieldglass for APAC Balance of Trade and Procure-to-Pay.
    • Automated reporting pipelines with Tableau, SQL and AI agents, cutting manual reporting effort by 30–40% and making reports more consistent.
    • Agent-run report refresh. Set up agent workflows that pull data from the source systems, refresh the Tableau and MicroStrategy reports and send them on schedule.
    • AI data-quality checks. Built an AI workflow that flagged duplicates, missing fields and outliers in supplier master data, invoices and payments before the reports went out.
    • AI report commentary. Used an AI agent to draft executive summaries from the dashboard data, and reviewed every draft before it was sent.
    • Turned operational data into insights for payment prioritisation, supplier risk and business decisions.
    • Worked with operations, procurement, finance and technology teams on reporting, process improvements and AI automation.

    Tableau · MicroStrategy · SQL · AI agents · Quantum GEP · Zephyr · SAP Fieldglass

  3. 2024 – 2025

    Technical Project Coordinator

    BE3 Power Solutions Enterprise · Taytay, Rizal

    Coordinated the build of a project monitoring and inventory system for BE3, from requirements to sign-off.

    • Ran requirements interviews with sales, warehouse and accounting staff, and mapped the process in BPMN.
    • Coordinated alpha and beta testing with staff in four roles, who rated the system between “agree” and “strongly agree”.
    What I did
    • Acted as the link between BE3’s stakeholders and the development team for the whole build.
    • Led a reverse-waterfall approach: first a working C# and MySQL prototype (project monitoring, sales, inventory, reports, audit trail), then refinements based on client feedback.
    • Helped formalise delivery with BE3 management: the non-disclosure agreement, the letter of agreement and final user acceptance.

    C# · MySQL · Project coordination · BPMN · Requirements gathering

  4. 2021 – 2022

    Database Administrator

    Provincial Public Employment Service Office · Rizal

    Maintained the office’s employment records database.

Tools

Works with your stack

26 tools across data engineering, BI, data science, business platforms and AI.

Data engineering

  • SQLQuery language
  • SnowflakeCloud data warehouse
  • ETL / ELTData pipelines

BI & visualisation

  • TableauData visualisation
  • Power BIBusiness intelligence
  • Excel, PivotTables, Power QueryReporting & analysis
  • Looker StudioDashboards & reporting
  • MicroStrategyEnterprise analytics

Data science

  • Python (pandas)Data analysis
  • NumPy, NLTK, MatplotlibNumerical & language analysis
  • RStatistical computing

Business platforms & operations

  • Google WorkspaceProductivity & collaboration
  • NotionWorkspace & documentation
  • SAP FieldglassSupplier management
  • Quantum GEPProcurement
  • ZephyrTest management
  • ClickUpProject management
  • JiraProject tracking
  • SlackTeam communication
  • SalesforceCRM
  • SE RankingSEO & rank tracking
  • SemrushSEO & competitor research

AI & automation

  • Claude, Claude CodeAI assistant & coding agent
  • ChatGPTAI assistant
  • LovableAI website builder
  • n8nWorkflow automation

Credentials

Certified, and verifiable

BS Information Technology

STI College Ortigas-Cainta · 2021 – 2025

Capstone: the BE3 project monitoring and inventory system, shown in Selected work. I coordinated its build as BE3’s technical project coordinator.

FAQ

Questions recruiters ask

What roles are you looking for?

Remote data analyst, BI analyst, analytics engineering and AI operations roles, where I can work across the pipeline, the dashboard and the model.

Can you work remotely?

Yes. I already lead a remote team for a New York company from Rizal, Philippines (GMT+8).

Which tools do you use most?

SQL, Python, Snowflake, Tableau and Power BI, with Excel and Looker Studio. The full list of 26 is under Tools.

Can I see your work in detail?

Yes. Every project except the BE3 capstone links to a live dashboard, a GitHub repository or a downloadable Power BI file. The capstone shows its screens.

How quickly do you reply?

Usually within a day. Email is the fastest way to reach me.

Have a role or a project in mind?

Tell me about it in a short message. It comes straight to my inbox.

Send me a message

  • Reply within a day
  • Rizal, Philippines · GMT+8
  • Open to remote roles
Email
matthew.p.ferrer@gmail.com
Phone
+63 960 875 2284
LinkedIn
matthew-ferrer-profile
GitHub
KeigoDev

Contact

Let’s talk.

All fields are required. I reply within a day.